mirror of
https://github.com/wassname/geopandas.git
synced 2026-09-20 12:50:47 +08:00

71 KiB
71 KiB
In [1]:
from IPython.core.display import Image
Image(url='https://web.natur.cuni.cz/~langhamr/lectures/vtfg1/mapinfo_1/about_gis/Image23.gif')
Out [1]:
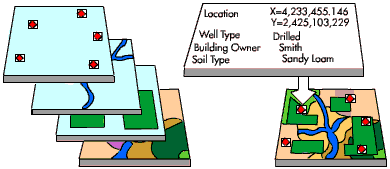
In [2]:
%matplotlib inline
from shapely.geometry import Point
from geopandas import datasets, GeoDataFrame, read_file
from geopandas.tools import overlay

# NYC Boros
zippath = datasets.get_path('nybb')
polydf = read_file(zippath)

# Generate some points
b = [int(x) for x in polydf.total_bounds]
N = 8
pointdf = GeoDataFrame([
    {'geometry': Point(x, y), 'value1': x + y, 'value2': x - y}
    for x, y in zip(range(b[0], b[2], int((b[2] - b[0]) / N)),
                    range(b[1], b[3], int((b[3] - b[1]) / N)))])

# Make sure they're using the same projection reference
pointdf.crs = polydf.crs
In [3]:
pointdfOut [3]:
| geometry | value1 | value2 | |
|---|---|---|---|
| 0 | POINT (913175 120121) | 1033296 | 793054 |
| 1 | POINT (932450 139211) | 1071661 | 793239 |
| 2 | POINT (951725 158301) | 1110026 | 793424 |
| 3 | POINT (971000 177391) | 1148391 | 793609 |
| 4 | POINT (990275 196481) | 1186756 | 793794 |
| 5 | POINT (1009550 215571) | 1225121 | 793979 |
| 6 | POINT (1028825 234661) | 1263486 | 794164 |
| 7 | POINT (1048100 253751) | 1301851 | 794349 |
| 8 | POINT (1067375 272841) | 1340216 | 794534 |
In [4]:
polydfOut [4]:
| BoroCode | BoroName | Shape_Leng | Shape_Area | geometry | |
|---|---|---|---|---|---|
| 0 | 5 | Staten Island | 330470.010332 | 1.623820e+09 | (POLYGON ((970217.0223999023 145643.3322143555... |
| 1 | 4 | Queens | 896344.047763 | 3.045213e+09 | (POLYGON ((1029606.076599121 156073.8142089844... |
| 2 | 3 | Brooklyn | 741080.523166 | 1.937479e+09 | (POLYGON ((1021176.479003906 151374.7969970703... |
| 3 | 1 | Manhattan | 359299.096471 | 6.364715e+08 | (POLYGON ((981219.0557861328 188655.3157958984... |
| 4 | 2 | Bronx | 464392.991824 | 1.186925e+09 | (POLYGON ((1012821.805786133 229228.2645874023... |
In [5]:
pointdf.plot()Out [5]:
<matplotlib.axes._subplots.AxesSubplot at 0x4f1b0b8>

In [6]:
polydf.plot()Out [6]:
<matplotlib.axes._subplots.AxesSubplot at 0x12991208>

In [7]:
from geopandas.tools import sjoin
join_left_df = sjoin(pointdf, polydf, how="left")
join_left_df
# Note the NaNs where the point did not intersect a boro
Out [7]:
| geometry | value1 | value2 | index_right | BoroCode | BoroName | Shape_Leng | Shape_Area | |
|---|---|---|---|---|---|---|---|---|
| 0 | POINT (913175 120121) | 1033296 | 793054 | NaN | NaN | NaN | NaN | NaN |
| 1 | POINT (932450 139211) | 1071661 | 793239 | 0.0 | 5.0 | Staten Island | 330470.010332 | 1.623820e+09 |
| 2 | POINT (951725 158301) | 1110026 | 793424 | 0.0 | 5.0 | Staten Island | 330470.010332 | 1.623820e+09 |
| 3 | POINT (971000 177391) | 1148391 | 793609 | NaN | NaN | NaN | NaN | NaN |
| 4 | POINT (990275 196481) | 1186756 | 793794 | NaN | NaN | NaN | NaN | NaN |
| 5 | POINT (1009550 215571) | 1225121 | 793979 | 1.0 | 4.0 | Queens | 896344.047763 | 3.045213e+09 |
| 6 | POINT (1028825 234661) | 1263486 | 794164 | 4.0 | 2.0 | Bronx | 464392.991824 | 1.186925e+09 |
| 7 | POINT (1048100 253751) | 1301851 | 794349 | NaN | NaN | NaN | NaN | NaN |
| 8 | POINT (1067375 272841) | 1340216 | 794534 | NaN | NaN | NaN | NaN | NaN |
In [8]:
join_right_df = sjoin(pointdf, polydf, how="right")
join_right_df
# Note Staten Island is repeated
Out [8]:
| index_left | value1 | value2 | BoroCode | BoroName | Shape_Leng | Shape_Area | geometry | |
|---|---|---|---|---|---|---|---|---|
| index_right | ||||||||
| 0 | 1.0 | 1071661.0 | 793239.0 | 5 | Staten Island | 330470.010332 | 1.623820e+09 | (POLYGON ((970217.0223999023 145643.3322143555... |
| 0 | 2.0 | 1110026.0 | 793424.0 | 5 | Staten Island | 330470.010332 | 1.623820e+09 | (POLYGON ((970217.0223999023 145643.3322143555... |
| 1 | 5.0 | 1225121.0 | 793979.0 | 4 | Queens | 896344.047763 | 3.045213e+09 | (POLYGON ((1029606.076599121 156073.8142089844... |
| 4 | 6.0 | 1263486.0 | 794164.0 | 2 | Bronx | 464392.991824 | 1.186925e+09 | (POLYGON ((1012821.805786133 229228.2645874023... |
| 2 | NaN | NaN | NaN | 3 | Brooklyn | 741080.523166 | 1.937479e+09 | (POLYGON ((1021176.479003906 151374.7969970703... |
| 3 | NaN | NaN | NaN | 1 | Manhattan | 359299.096471 | 6.364715e+08 | (POLYGON ((981219.0557861328 188655.3157958984... |
In [9]:
join_inner_df = sjoin(pointdf, polydf, how="inner")
join_inner_df
# Note the lack of NaNs; dropped anything that didn't intersect
Out [9]:
| geometry | value1 | value2 | index_right | BoroCode | BoroName | Shape_Leng | Shape_Area | |
|---|---|---|---|---|---|---|---|---|
| 1 | POINT (932450 139211) | 1071661 | 793239 | 0 | 5 | Staten Island | 330470.010332 | 1.623820e+09 |
| 2 | POINT (951725 158301) | 1110026 | 793424 | 0 | 5 | Staten Island | 330470.010332 | 1.623820e+09 |
| 5 | POINT (1009550 215571) | 1225121 | 793979 | 1 | 4 | Queens | 896344.047763 | 3.045213e+09 |
| 6 | POINT (1028825 234661) | 1263486 | 794164 | 4 | 2 | Bronx | 464392.991824 | 1.186925e+09 |
In [10]:
sjoin(pointdf, polydf, how="left", op="within")Out [10]:
| geometry | value1 | value2 | index_right | BoroCode | BoroName | Shape_Leng | Shape_Area | |
|---|---|---|---|---|---|---|---|---|
| 0 | POINT (913175 120121) | 1033296 | 793054 | NaN | NaN | NaN | NaN | NaN |
| 1 | POINT (932450 139211) | 1071661 | 793239 | 0.0 | 5.0 | Staten Island | 330470.010332 | 1.623820e+09 |
| 2 | POINT (951725 158301) | 1110026 | 793424 | 0.0 | 5.0 | Staten Island | 330470.010332 | 1.623820e+09 |
| 3 | POINT (971000 177391) | 1148391 | 793609 | NaN | NaN | NaN | NaN | NaN |
| 4 | POINT (990275 196481) | 1186756 | 793794 | NaN | NaN | NaN | NaN | NaN |
| 5 | POINT (1009550 215571) | 1225121 | 793979 | 1.0 | 4.0 | Queens | 896344.047763 | 3.045213e+09 |
| 6 | POINT (1028825 234661) | 1263486 | 794164 | 4.0 | 2.0 | Bronx | 464392.991824 | 1.186925e+09 |
| 7 | POINT (1048100 253751) | 1301851 | 794349 | NaN | NaN | NaN | NaN | NaN |
| 8 | POINT (1067375 272841) | 1340216 | 794534 | NaN | NaN | NaN | NaN | NaN |