mirror of
https://github.com/wassname/geopandas.git
synced 2026-09-25 13:40:11 +08:00
 François Leblanc
7a7a3c8e1d
François Leblanc
7a7a3c8e1d
* fixed nybb

* rearrange chloropleths example

* added badge to MyBinder

* extra formatting on README

* add extra info in chrolopleths.ipynb

* Update choropleths example
199 KiB
199 KiB
In [1]:
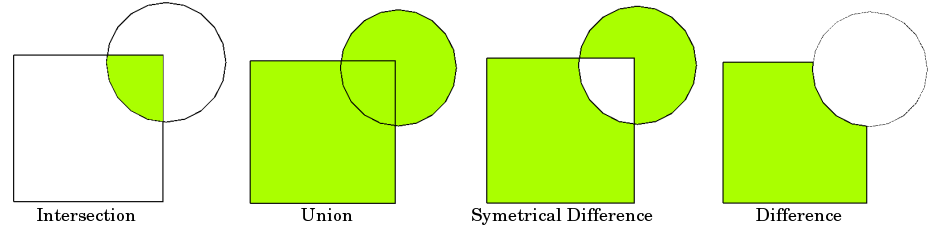
from IPython.core.display import Image
Image(url="http://docs.qgis.org/testing/en/_images/overlay_operations.png")
Out [1]:
In [2]:
%matplotlib inline
from shapely.geometry import Point
from geopandas import datasets, GeoDataFrame, read_file
from geopandas.tools import overlay

# NYC Boros
zippath = datasets.get_path('nybb')
polydf = read_file(zippath)

# Generate some circles
b = [int(x) for x in polydf.total_bounds]
N = 10
polydf2 = GeoDataFrame([
    {'geometry': Point(x, y).buffer(10000), 'value1': x + y, 'value2': x - y}
    for x, y in zip(range(b[0], b[2], int((b[2] - b[0]) / N)),
range(b[1], b[3], int((b[3] - b[1]) / N)))])In [3]:
polydf.plot()Out [3]:
<matplotlib.axes._subplots.AxesSubplot at 0x512ee48>

In [4]:
polydf2.plot(cmap='tab20b')Out [4]:
<matplotlib.axes._subplots.AxesSubplot at 0x512e0f0>

In [5]:
from geopandas.tools import overlay
newdf = overlay(polydf, polydf2, how="intersection")
newdf.plot(cmap='tab20b')
Out [5]:
<matplotlib.axes._subplots.AxesSubplot at 0x12978940>

In [6]:
polydf.head()Out [6]:
| BoroCode | BoroName | Shape_Leng | Shape_Area | geometry | |
|---|---|---|---|---|---|
| 0 | 5 | Staten Island | 330470.010332 | 1.623820e+09 | (POLYGON ((970217.0223999023 145643.3322143555... |
| 1 | 4 | Queens | 896344.047763 | 3.045213e+09 | (POLYGON ((1029606.076599121 156073.8142089844... |
| 2 | 3 | Brooklyn | 741080.523166 | 1.937479e+09 | (POLYGON ((1021176.479003906 151374.7969970703... |
| 3 | 1 | Manhattan | 359299.096471 | 6.364715e+08 | (POLYGON ((981219.0557861328 188655.3157958984... |
| 4 | 2 | Bronx | 464392.991824 | 1.186925e+09 | (POLYGON ((1012821.805786133 229228.2645874023... |
In [7]:
polydf2.head()Out [7]:
| geometry | value1 | value2 | |
|---|---|---|---|
| 0 | POLYGON ((923175 120121, 923126.847266722 1191... | 1033296 | 793054 |
| 1 | POLYGON ((938595 135393, 938546.847266722 1344... | 1063988 | 793202 |
| 2 | POLYGON ((954015 150665, 953966.847266722 1496... | 1094680 | 793350 |
| 3 | POLYGON ((969435 165937, 969386.847266722 1649... | 1125372 | 793498 |
| 4 | POLYGON ((984855 181209, 984806.847266722 1802... | 1156064 | 793646 |
In [8]:
newdf.head()Out [8]:
| BoroCode | BoroName | Shape_Leng | Shape_Area | value1 | value2 | geometry | |
|---|---|---|---|---|---|---|---|
| 0 | 5 | Staten Island | 330470.010332 | 1.623820e+09 | 1033296 | 793054 | POLYGON ((916755.4256330276 129447.9617643995,... |
| 1 | 5 | Staten Island | 330470.010332 | 1.623820e+09 | 1063988 | 793202 | POLYGON ((938595 135393, 938546.847266722 1344... |
| 2 | 5 | Staten Island | 330470.010332 | 1.623820e+09 | 1125372 | 793498 | POLYGON ((961436.3049926758 175473.0296020508,... |
| 3 | 5 | Staten Island | 330470.010332 | 1.623820e+09 | 1094680 | 793350 | POLYGON ((954015 150665, 953966.847266722 1496... |
| 4 | 2 | Bronx | 464392.991824 | 1.186925e+09 | 1309524 | 794386 | POLYGON ((1043287.193237305 260300.0289916992,... |
In [9]:
newdf = overlay(polydf, polydf2, how="union")
newdf.plot(cmap='tab20b')
Out [9]:
<matplotlib.axes._subplots.AxesSubplot at 0x12a72e48>

In [10]:
newdf = overlay(polydf, polydf2, how="identity")
newdf.plot(cmap='tab20b')
Out [10]:
<matplotlib.axes._subplots.AxesSubplot at 0x12bccda0>

In [11]:
newdf = overlay(polydf, polydf2, how="symmetric_difference")
newdf.plot(cmap='tab20b')
Out [11]:
<matplotlib.axes._subplots.AxesSubplot at 0x12dc2710>

In [12]:
newdf = overlay(polydf, polydf2, how="difference")
newdf.plot(cmap='tab20b')
Out [12]:
<matplotlib.axes._subplots.AxesSubplot at 0x12e13630>
