# optuna-dashboard
 [](https://pypistats.org/packages/optuna-dashboard)
Real-time dashboard for [Optuna](https://github.com/optuna/optuna).
Code files were originally taken from [Goptuna](https://github.com/c-bata/goptuna).
## Installation
You can install optuna-dashboard via [PyPI](https://pypi.org/project/optuna-dashboard/) or [Anaconda Cloud](https://anaconda.org/conda-forge/optuna-dashboard).
```
$ pip install optuna-dashboard
```
Also you can install following optional dependencies to make optuna-dashboard faster.
```console
$ pip install optuna-fast-fanova gunicorn
```
## Getting Started
First, please specify the storage URL to persistent your study using the [RDB backend](https://optuna.readthedocs.io/en/stable/tutorial/20_recipes/001_rdb.html).
```python
import optuna
def objective(trial):
x = trial.suggest_float("x", -100, 100)
y = trial.suggest_categorical("y", [-1, 0, 1])
return x**2 + y
if __name__ == "__main__":
study = optuna.create_study(
storage="sqlite:///db.sqlite3", # Specify the storage URL here.
study_name="quadratic-simple"
)
study.optimize(objective, n_trials=100)
print(f"Best value: {study.best_value} (params: {study.best_params})")
```
After running the above script, please execute the `optuna-dashboard` command with Optuna storage URL.
```
$ optuna-dashboard sqlite:///db.sqlite3
Listening on http://localhost:8080/
Hit Ctrl-C to quit.
```
More command line options
```console
$ optuna-dashboard -h
usage: optuna-dashboard [-h] [--port PORT] [--host HOST] [--version] [--quiet] storage
Real-time dashboard for Optuna.
positional arguments:
storage DB URL (e.g. sqlite:///example.db)
optional arguments:
-h, --help show this help message and exit
--port PORT port number (default: 8080)
--host HOST hostname (default: 127.0.0.1)
--server {wsgiref,gunicorn}
server (default: auto)
--version, -v show program's version number and exit
--quiet, -q quiet
```
Python Interface
**`run_server(storage: Union[str, BaseStorage], host: str = 'localhost', port: int = 8080) -> None`**
Start running optuna-dashboard and blocks until the server terminates.
This function uses wsgiref module which is not intended for the production use.
**`wsgi(storage: Union[str, BaseStorage]) -> WSGIApplication`**
This function exposes WSGI interface for people who want to run on the
production-class WSGI servers like Gunicorn or uWSGI.
## Using an official Docker image
You can also use [an official Docker image](https://github.com/optuna/optuna-dashboard/pkgs/container/optuna-dashboard) instead of setting up your Python environment.
The Docker image only supports SQLite3, MySQL(PyMySQL), and PostgreSQL(Psycopg2).
```
$ docker run -it --rm -p 8080:8080 -v `pwd`:/app -w /app \
> ghcr.io/optuna/optuna-dashboard sqlite:///db.sqlite3
```
MySQL (PyMySQL)
```
$ docker run -it --rm -p 8080:8080 ghcr.io/optuna/optuna-dashboard mysql+pymysql://username:password@hostname:3306/dbname
```
PostgreSQL (Psycopg2)
```
$ docker run -it --rm -p 8080:8080 ghcr.io/optuna/optuna-dashboard postgresql+psycopg2://username:password@hostname:5432/dbname
```
## Features
### Manage Studies
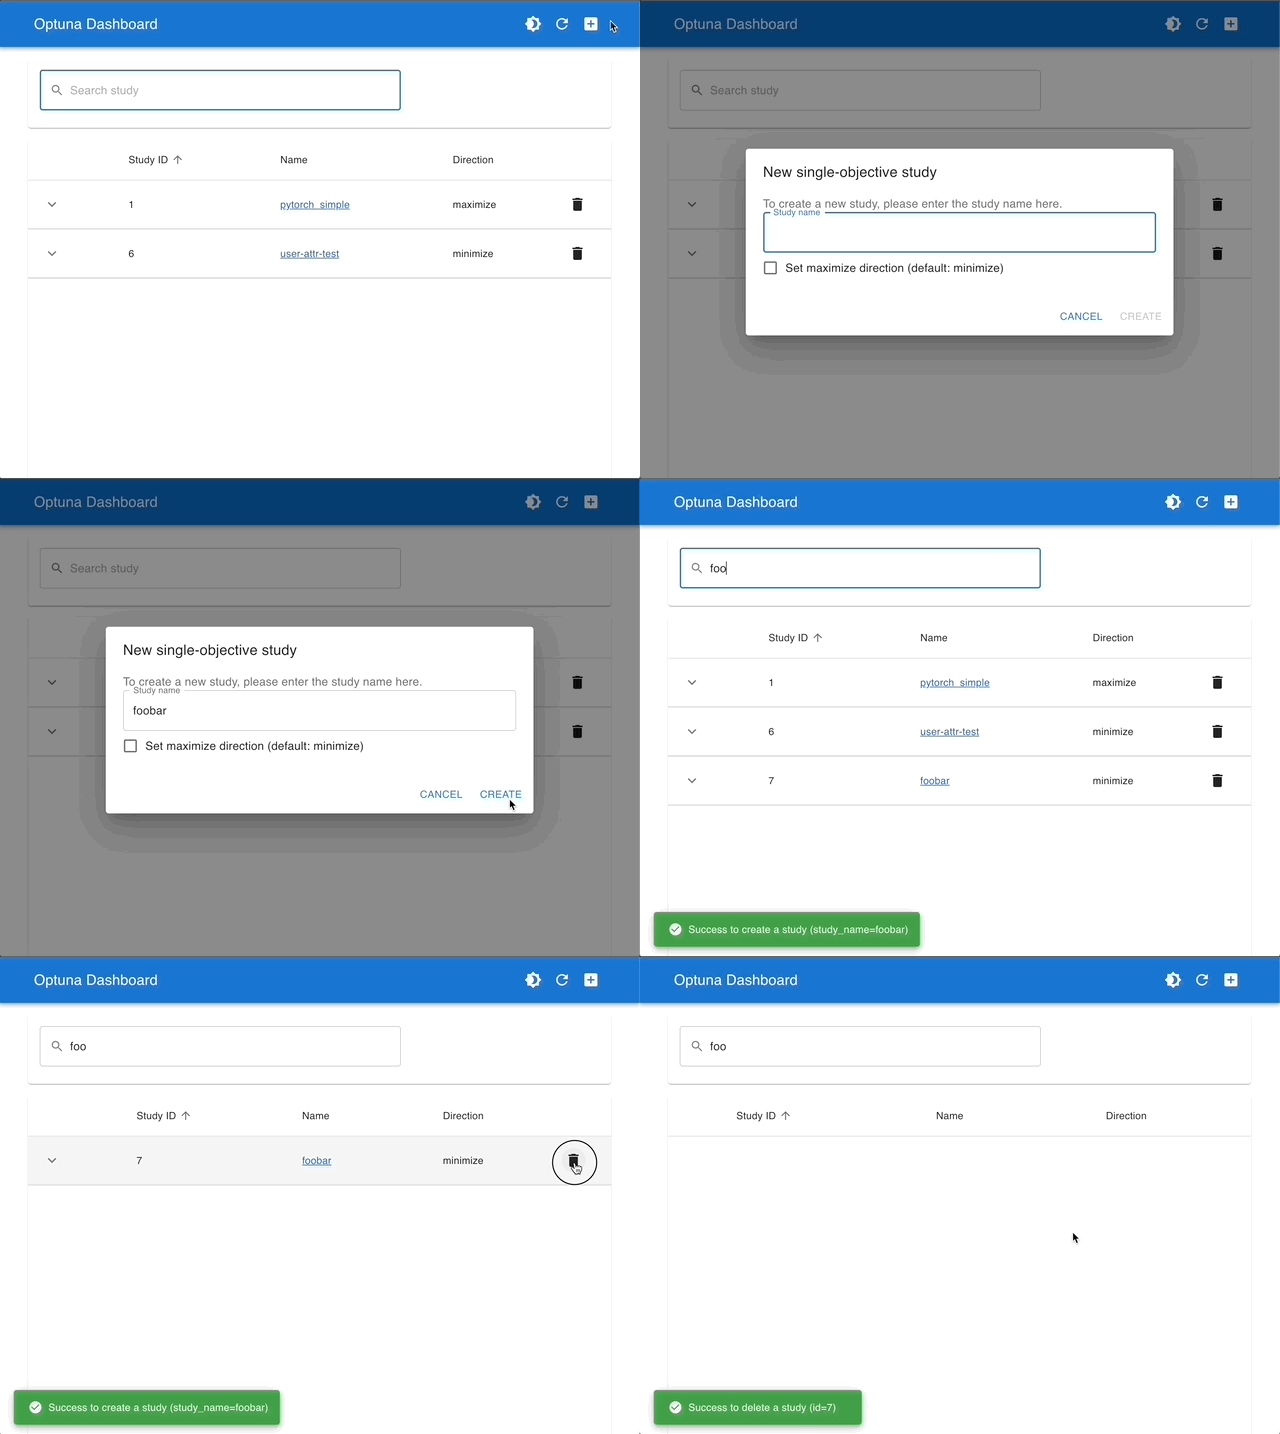
You can create and delete studies from Dashboard.
### Visualize with Interactive Graphs & Rich Trials Data Grid
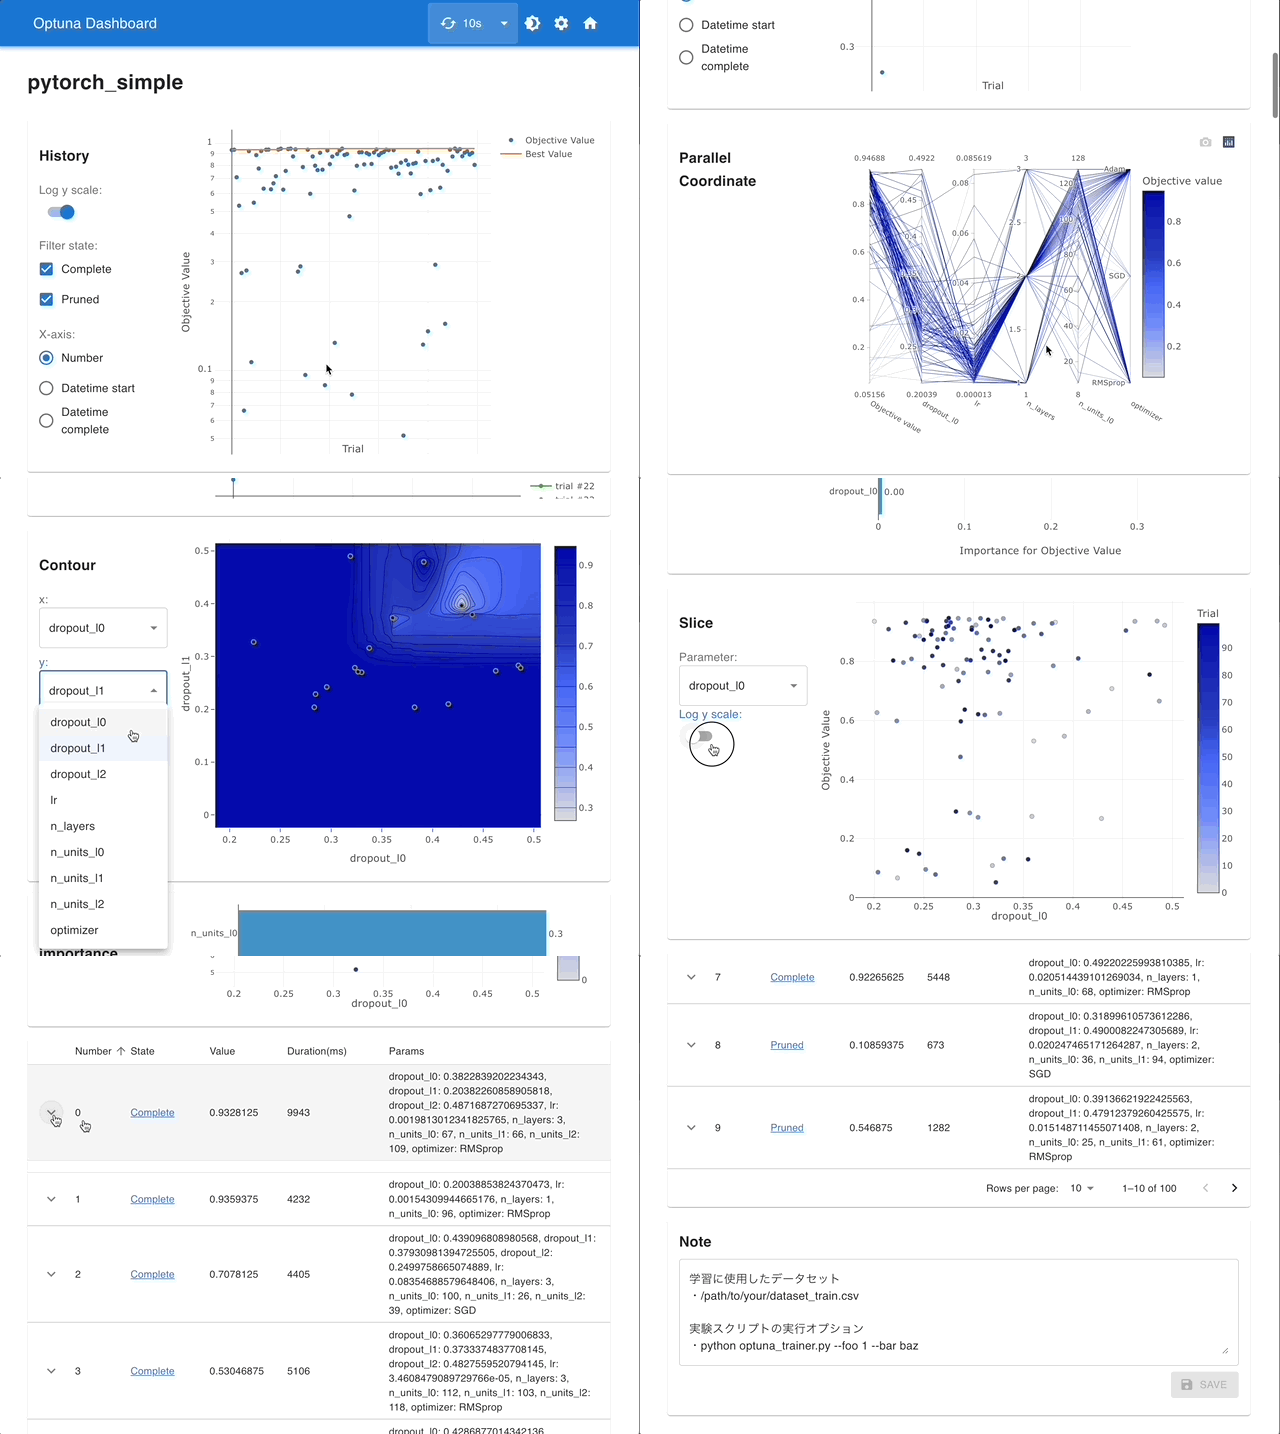
You can check the optimization history, hyperparameter importances, etc. in graphs and tables.
## Submitting patches
If you want to contribute, please check [Developers Guide](./CONTRIBUTING.md).