mirror of
https://github.com/wassname/optuna-dashboard.git
synced 2026-09-24 13:41:07 +08:00
 keisuke umezawaandHiroyuki Vincent Yamazaki
3ab18cf87f
keisuke umezawaandHiroyuki Vincent Yamazaki
3ab18cf87f
* Add compare studies

* Able to select multiple studies

Save

Save

* Able to plot multiple studies

* Remove warning

* Add toolbar

Save

* Fix setStudyDetailState

* Devide the file

* Add best lines

* Add x-axis, y-axis and pruned button

* Use compare icon

* Rename StudiesDetail to CompareStudies

* Stop useless server access

* Add edf plot

* Use filterTrials

* Fix legend

* Add object id to history plot

* Remove errors

* Add study information to list

* Disable studies

* Only enable onClick for the same n_obj

* Add link to home

* Unify GraphEdf

* Unify GraphHistory

* Change that one of studies is always selected and show an error message when a study can not be added

* Rebase against main

* Update optuna_dashboard/ts/components/CompareStudies.tsx

Co-authored-by: Hiroyuki Vincent Yamazaki <hiroyuki.vincent.yamazaki@gmail.com>

* Show the first study if query is not specified

* Revert TrialList change

* Change query paraater from numbers to ids

* Align the implementation with TrialList

* Unified implementation of useFilteredTrials and useFilteredTrialsFromStudies

* Use useMemo to get rid of unnecessary API requests

* Only enable onClick for the same directions

* Follow review comments

* Follow review comments

* Follow review comments

* Follow review comments

* Fix integration test

* Separate the implementation of edf and history for multi studies

* Revert GraphEdf and GraphEdfBeta

* Revert GraphHistory

* Follow review comments

* Follow review comments

---------

Co-authored-by: Hiroyuki Vincent Yamazaki <hiroyuki.vincent.yamazaki@gmail.com>
optuna-dashboard


Real-time dashboard for Optuna. Code files were originally taken from Goptuna.
Installation
You can install optuna-dashboard via PyPI or Anaconda Cloud.
$ pip install optuna-dashboard
Getting Started
First, please specify the storage URL to persistent your study using the RDB backend.
import optuna

def objective(trial):
    x = trial.suggest_float("x", -100, 100)
    y = trial.suggest_categorical("y", [-1, 0, 1])
    return x**2 + y

if __name__ == "__main__":
    study = optuna.create_study(
        storage="sqlite:///db.sqlite3",  # Specify the storage URL here.
        study_name="quadratic-simple"
    )
    study.optimize(objective, n_trials=100)
    print(f"Best value: {study.best_value} (params: {study.best_params})")
After running the above script, please execute the optuna-dashboard command with Optuna storage URL.
$ optuna-dashboard sqlite:///db.sqlite3
Listening on http://localhost:8080/
Hit Ctrl-C to quit.
Please check out our documentation for more details.
Using an official Docker image
You can also use an official Docker image instead of setting up your Python environment. The Docker image only supports SQLite3, MySQL(PyMySQL), and PostgreSQL(Psycopg2).
$ docker run -it --rm -p 8080:8080 -v `pwd`:/app -w /app \
> ghcr.io/optuna/optuna-dashboard sqlite:///db.sqlite3
MySQL (PyMySQL)
$ docker run -it --rm -p 8080:8080 ghcr.io/optuna/optuna-dashboard mysql+pymysql://username:password@hostname:3306/dbname
PostgreSQL (Psycopg2)
$ docker run -it --rm -p 8080:8080 ghcr.io/optuna/optuna-dashboard postgresql+psycopg2://username:password@hostname:5432/dbname
Features
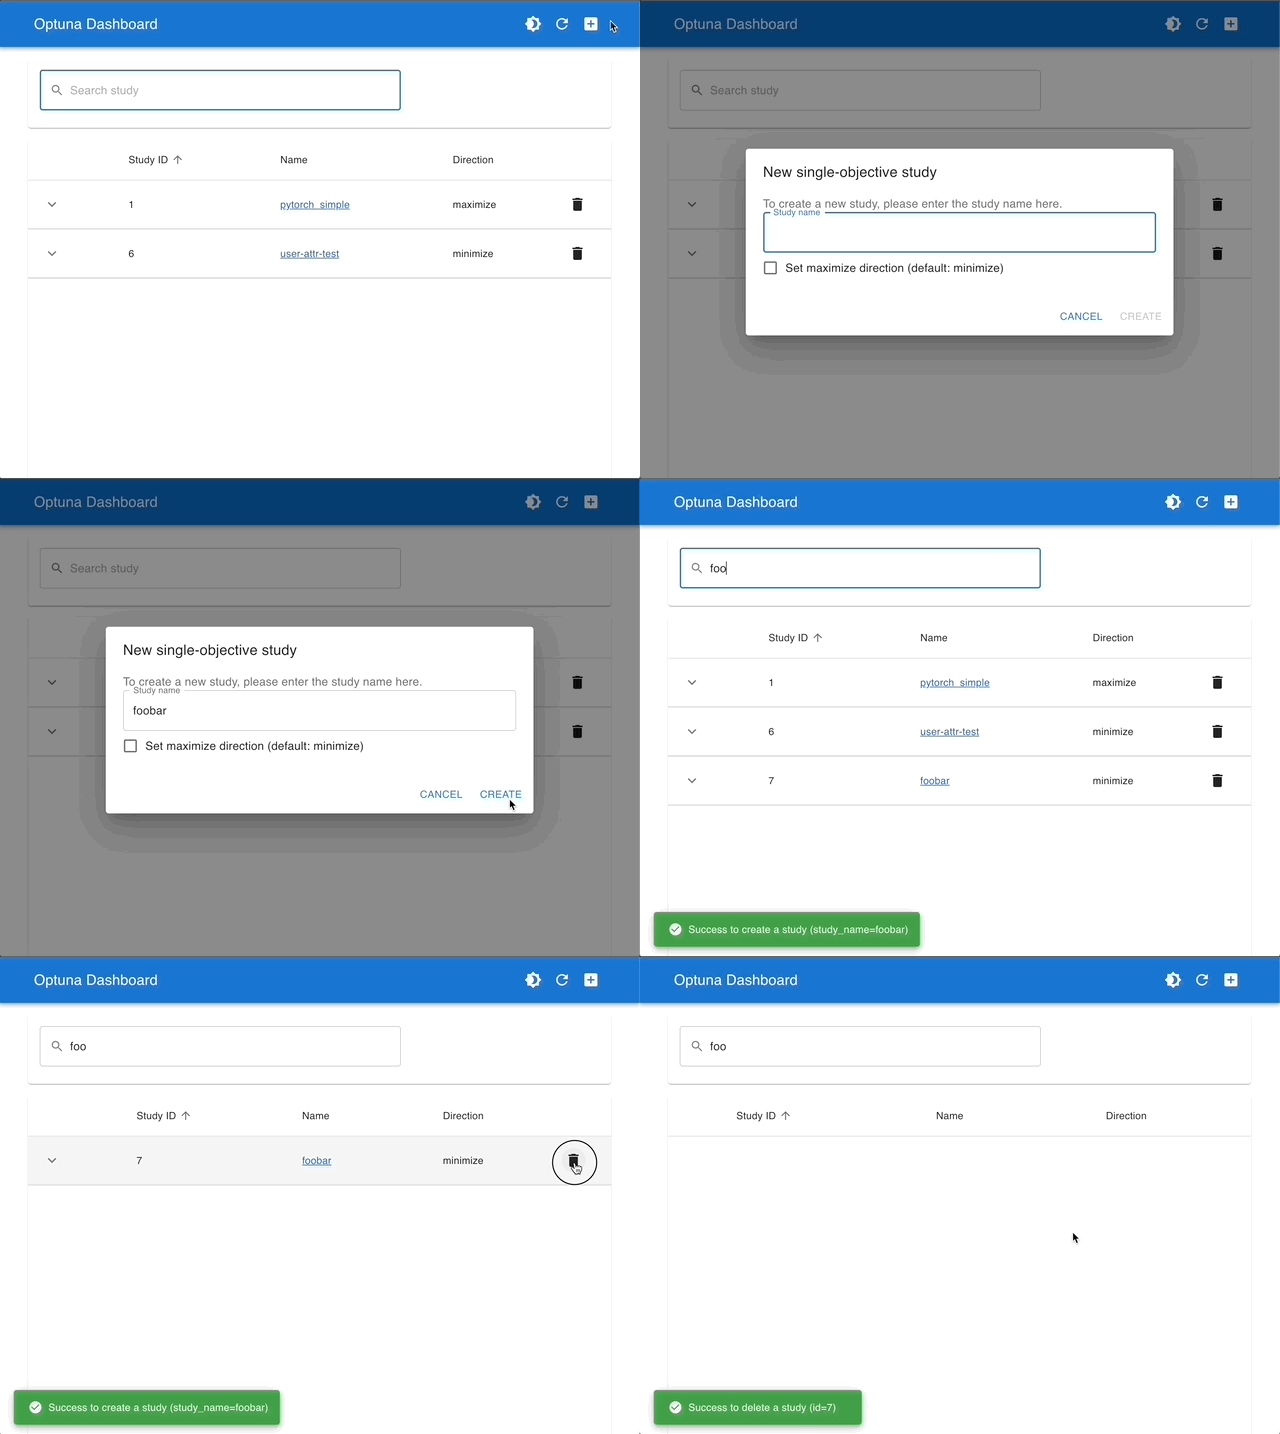
Manage Studies
You can create and delete studies from Dashboard.
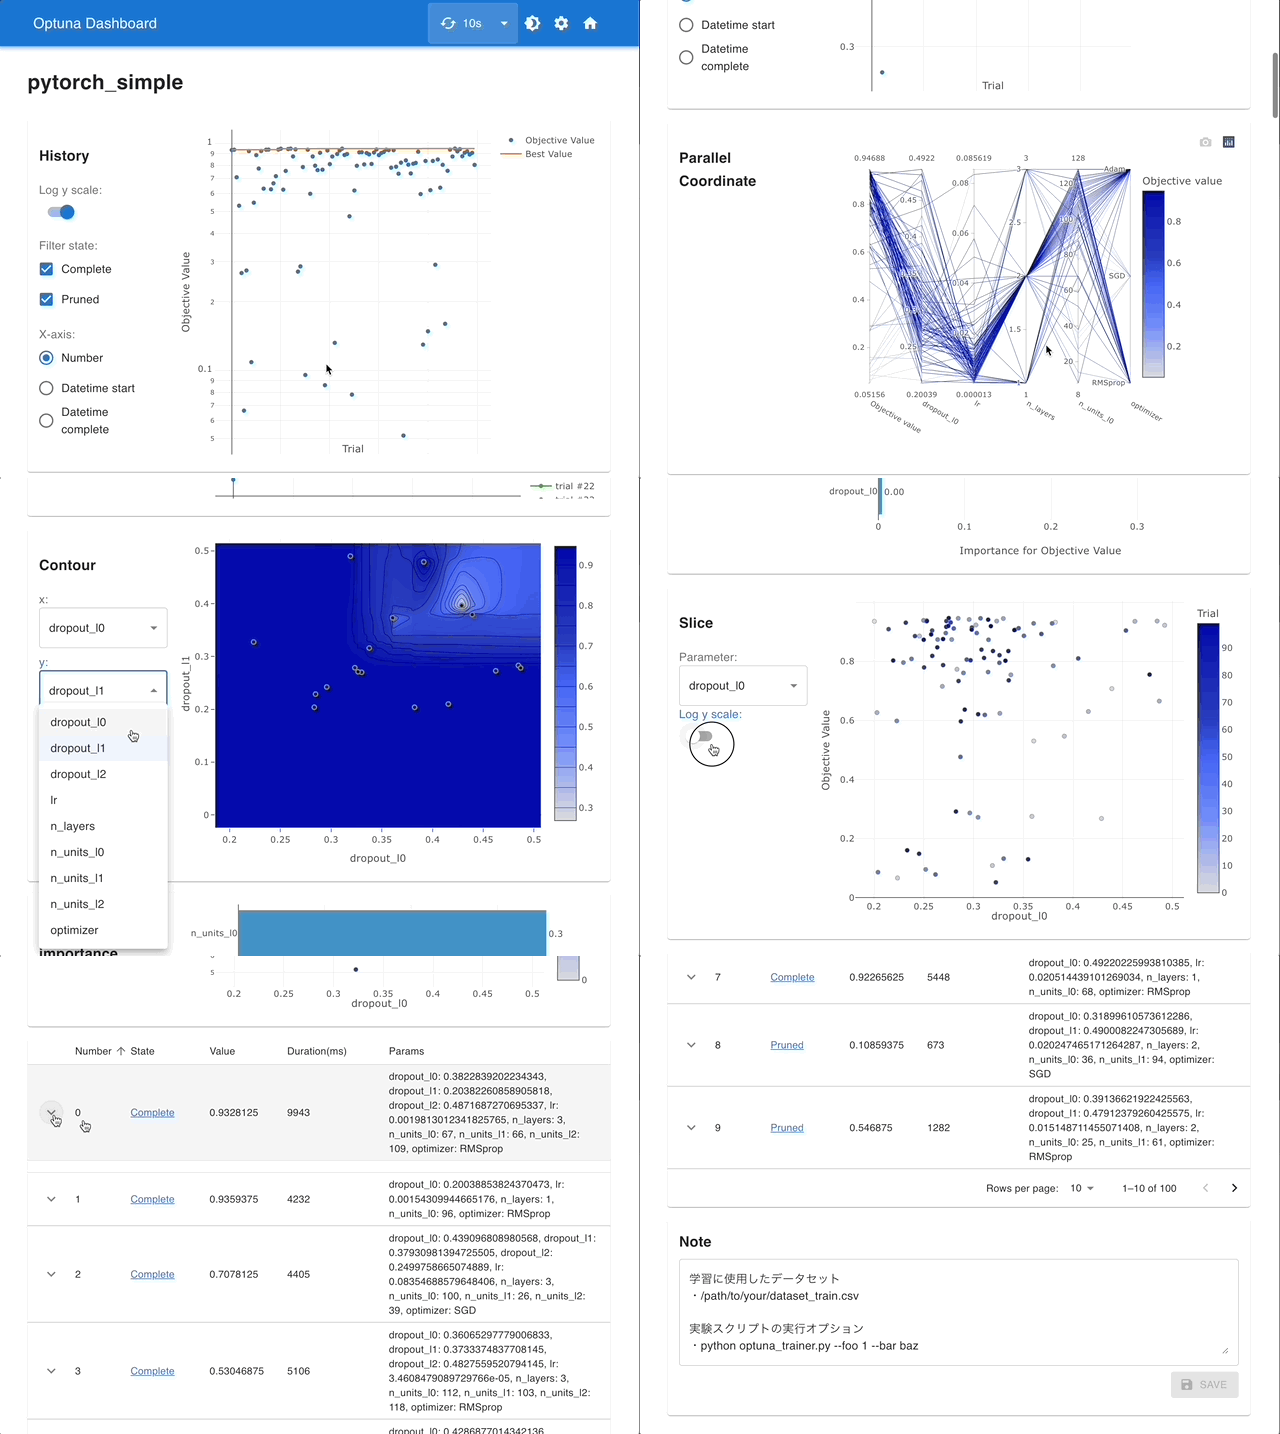
Visualize with Interactive Graphs & Rich Trials Data Grid
You can check the optimization history, hyperparameter importances, etc. in graphs and tables.
Submitting patches
If you want to contribute, please check Developers Guide.