mirror of
https://github.com/wassname/optuna-dashboard.git
synced 2026-09-09 11:28:14 +08:00

optuna-dashboard


Real-time dashboard for Optuna. Code files were originally taken from Goptuna.
Usage
You can install optuna-dashboard via pip.
$ pip install optuna-dashboard
After you installed, optuna-dashboard command is available.
Please execute it with Optuna storage URL.
$ optuna-dashboard sqlite:///db.sqlite3
Bottle v0.12.18 server starting up (using WSGIRefServer())...
Listening on http://localhost:8080/
Hit Ctrl-C to quit.
more command line options
$ optuna-dashboard -h
usage: optuna-dashboard [-h] [--port PORT] [--host HOST] [--version] [--quiet] storage

Real-time dashboard for Optuna.

positional arguments:
  storage        DB URL (e.g. sqlite:///example.db)

optional arguments:
  -h, --help     show this help message and exit
  --port PORT    port number (default: 8080)
  --host HOST    hostname (default: 127.0.0.1)
  --version, -v  show program's version number and exit
  --quiet, -q    quiet
Features
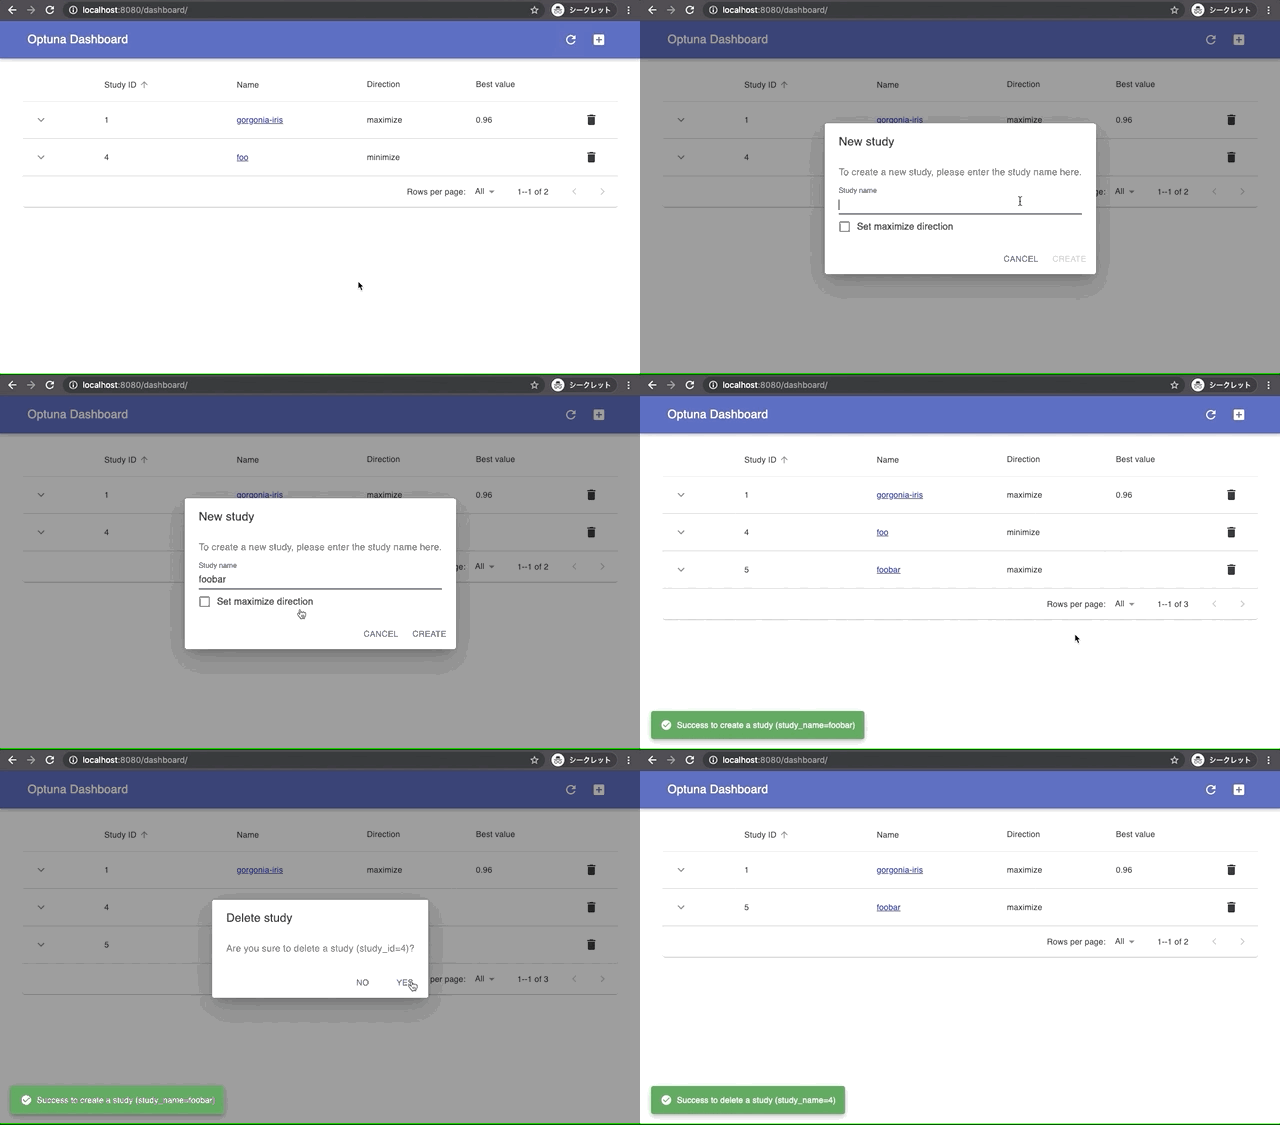
Create and delete study
You can create and delete a study from Dashboard.
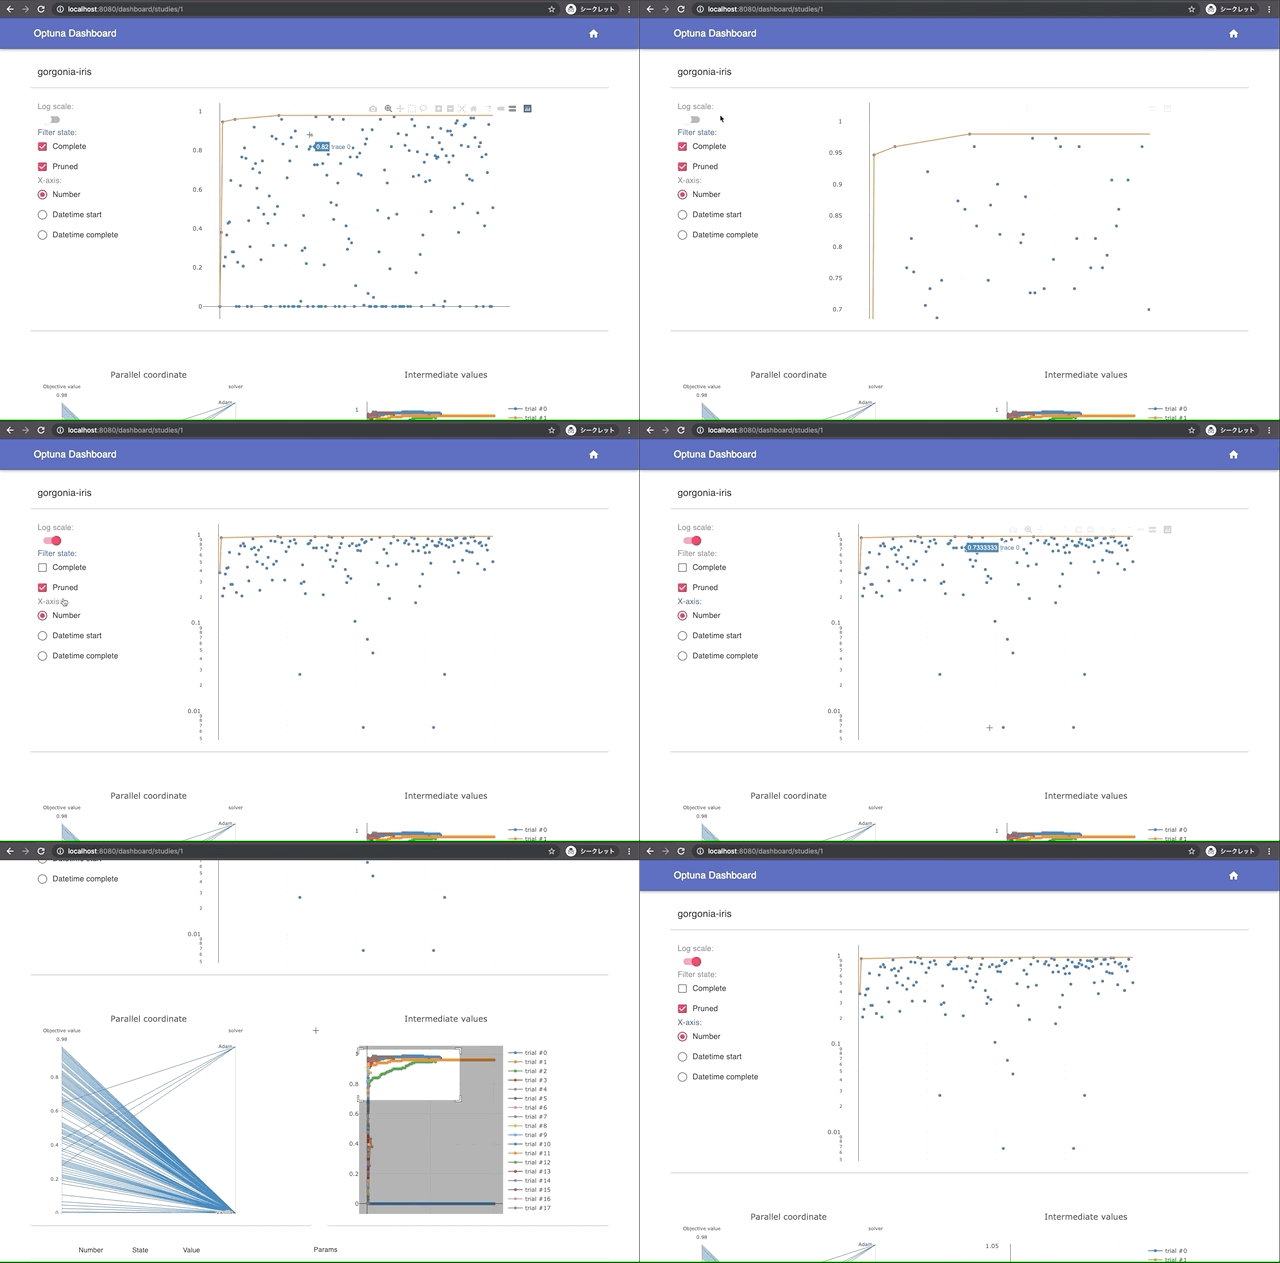
Interactive live-updating graphs
Interactive live-updating graphs for optimization history, parallel coordinate and intermediate values.
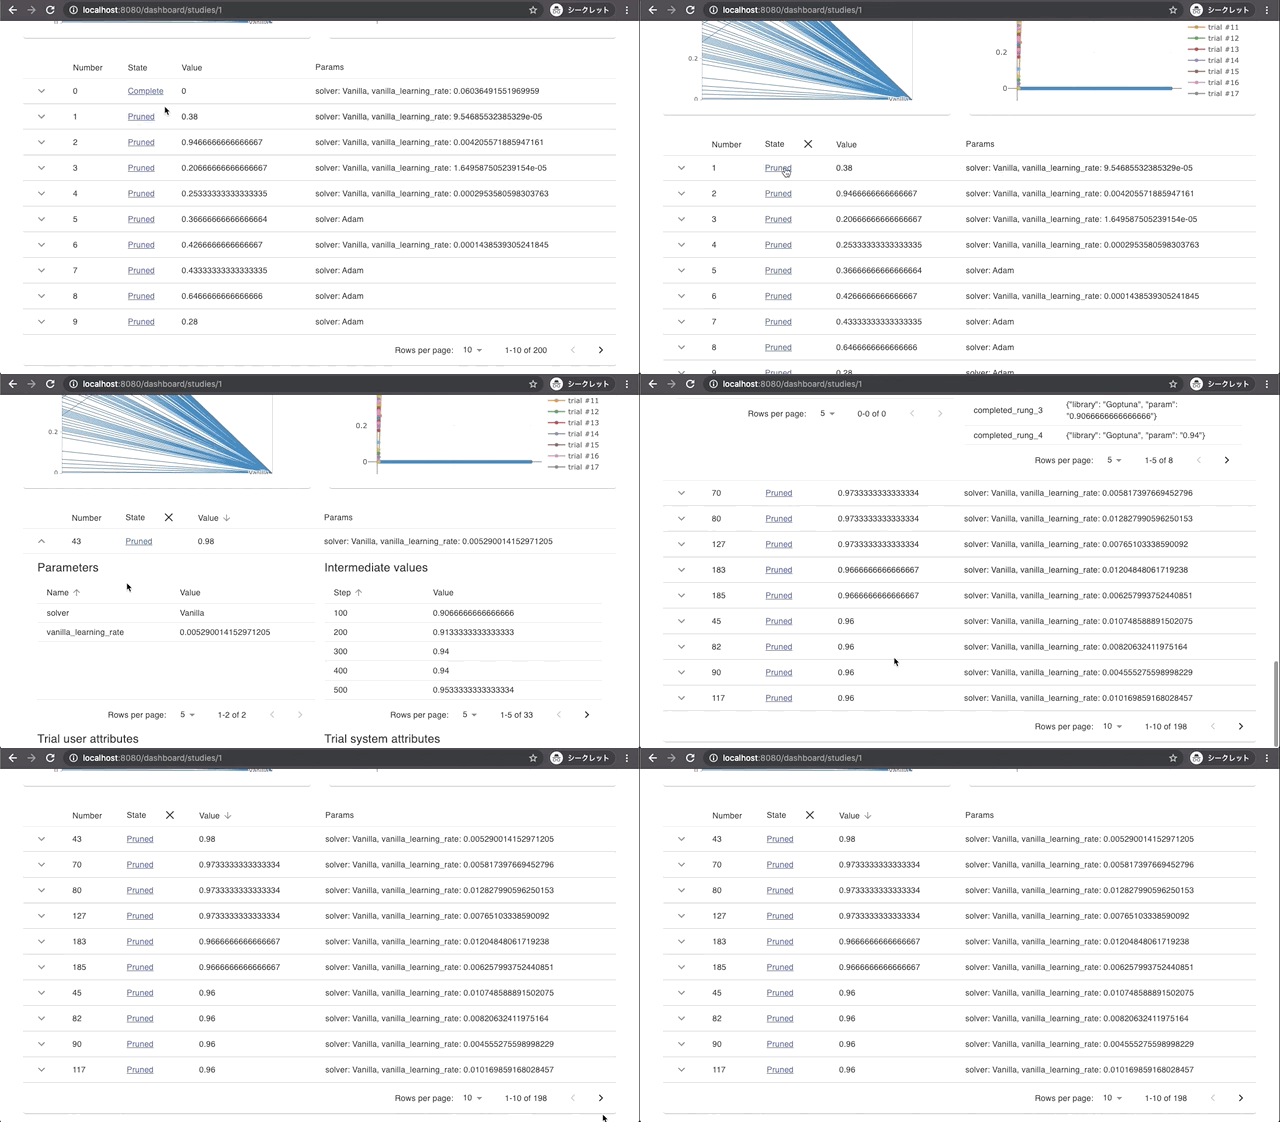
Rich trials data grid
You can walk-through trials by filtering and sorting.
Submitting patches
If you want to contribute, please check Developer Guide.
Alternatives
- 'optuna dashboard' subcommand: Official Optuna dashboard based on Bokeh CLI.
- ytsmiling/optdash: a third-party dashboard for optuna.